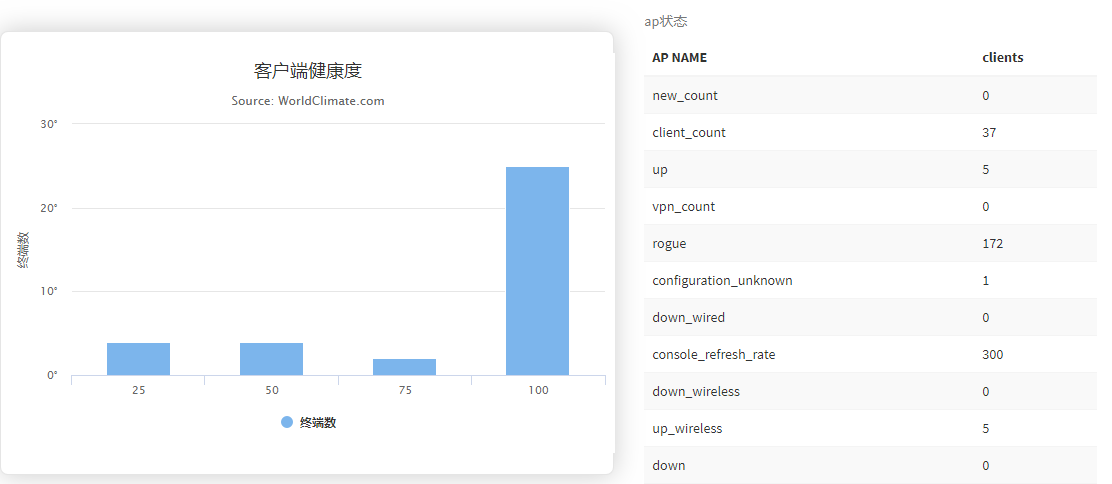
项目中引用vue2-highcharts ;
主要的几个函数为getChart(),update(),setCategories(),addSeries();removeSeries();
通过ajax请求后台接口;效果如下图

<template>
  <div class="row">

        <div class="row">
            <div class="col-lg-12">
                <div class="col-lg-4">
                    <vue-highcharts :options="healthoption" ref="health"></vue-highcharts>
                </div>

                 <!--客户端明细-->
                <div class="col-lg-3">
                    <table class="table table-striped">
                      <caption>ap状态</caption>
                      <thead>
                        <tr>
                          <th>  AP NAME</th>
                          <th>clients</th>
                        </tr>
                      </thead>
                      <tbody>
                        <tr v-for="apstatusdata in apstatusdatas">
                          <td>{{apstatusdata.name}}</td>
                          <td>{{apstatusdata.count}}</td>
                        </tr>

                      </tbody>
                    </table>
                </div>

            </div>
        </div>

  </div>


</template>


<script>
import VueHighcharts from 'vue2-highcharts';
import {ApList,getHeader,health,ApStatus} from './../../config.js';

export default{
    components: {
        VueHighcharts
    },
    data(){
      return{

        healthoption: {
                  chart: {
                    type: 'column'
                  },
                  title: {
                    text: '客户端健康度'
                  },
                  subtitle: {
                    text: 'Source: WorldClimate.com'
                  },
                  xAxis: {
                    categories: []
                  },
                  yAxis: {
                    title: {
                      text: '终端数'
                    },
                    labels: {
                      formatter: function () {
                        return this.value + '°';
                      }
                    }
                  },
                  tooltip: {
                    crosshairs: true,
                    shared: true
                  },
                  credits: {
                    enabled: false
                  },
                  plotOptions: {
                    spline: {
                      marker: {
                        radius: 4,
                        lineColor: '#666666',
                        lineWidth: 1
                      }
                    }
                  },
                  series: []
                },

        apstatusdatas:{},
      }
    },
    mounted() {
            this.healthdata()
            this.getApstatusData()
    },
    methods: {

      //健康度
      healthdata(){

            this.$http.get(health, {
                headers: getHeader()
            })
            .then((response) => {
                if (response.body.code === '200') {
                    let tempdata = response.body.data;
                    let length = tempdata.length;

                    let tempcategories = [];
                    let tempseries = [];
                    for(let i=0;i<length;i++){
                        tempcategories.push(tempdata[i]['key']);
                        tempseries.push({'y':tempdata[i]['value'],'name':tempdata[i]['key']+'%'});
                    }
                    this.healthoption.xAxis.categories = tempcategories;
                    let health = this.$refs.health;
                    health.getChart().title.update({ text: '客户端健康度' });
                    health.getChart().xAxis[0].setCategories(tempcategories);
                    let data = {

                              name: '终端数',
                              marker: {
                                symbol: 'column'
                              },
                              data: tempseries
                            }
                     // health.removeSeries();清除图表
                      health.delegateMethod('showLoading', 'Loading...');
                      health.addSeries(data);
                      health.hideLoading();
                }
            })
            .catch(function(response) {
                //console.log(response)
            })

      },
       getApstatusData(){
            this.$http.get(ApStatus, {
                headers: getHeader()
            })
            .then((response) => {
                if (response.body.code === '200') {
                    this.apstatusdatas = response.body.data;
                    console.log(response.body.data.client_count.count);
                }
            })
            .catch(function(response) {
                console.log(response)
            })
       },
    }
}
</script>